
Reading backtest results
What net return, drawdown, win rate, profit factor and the ratios mean, which assumptions the backtest makes and why a good result is not a promise.
A finished backtest shows a set of numbers and a chart. This page explains what each of them means and where they can mislead you.
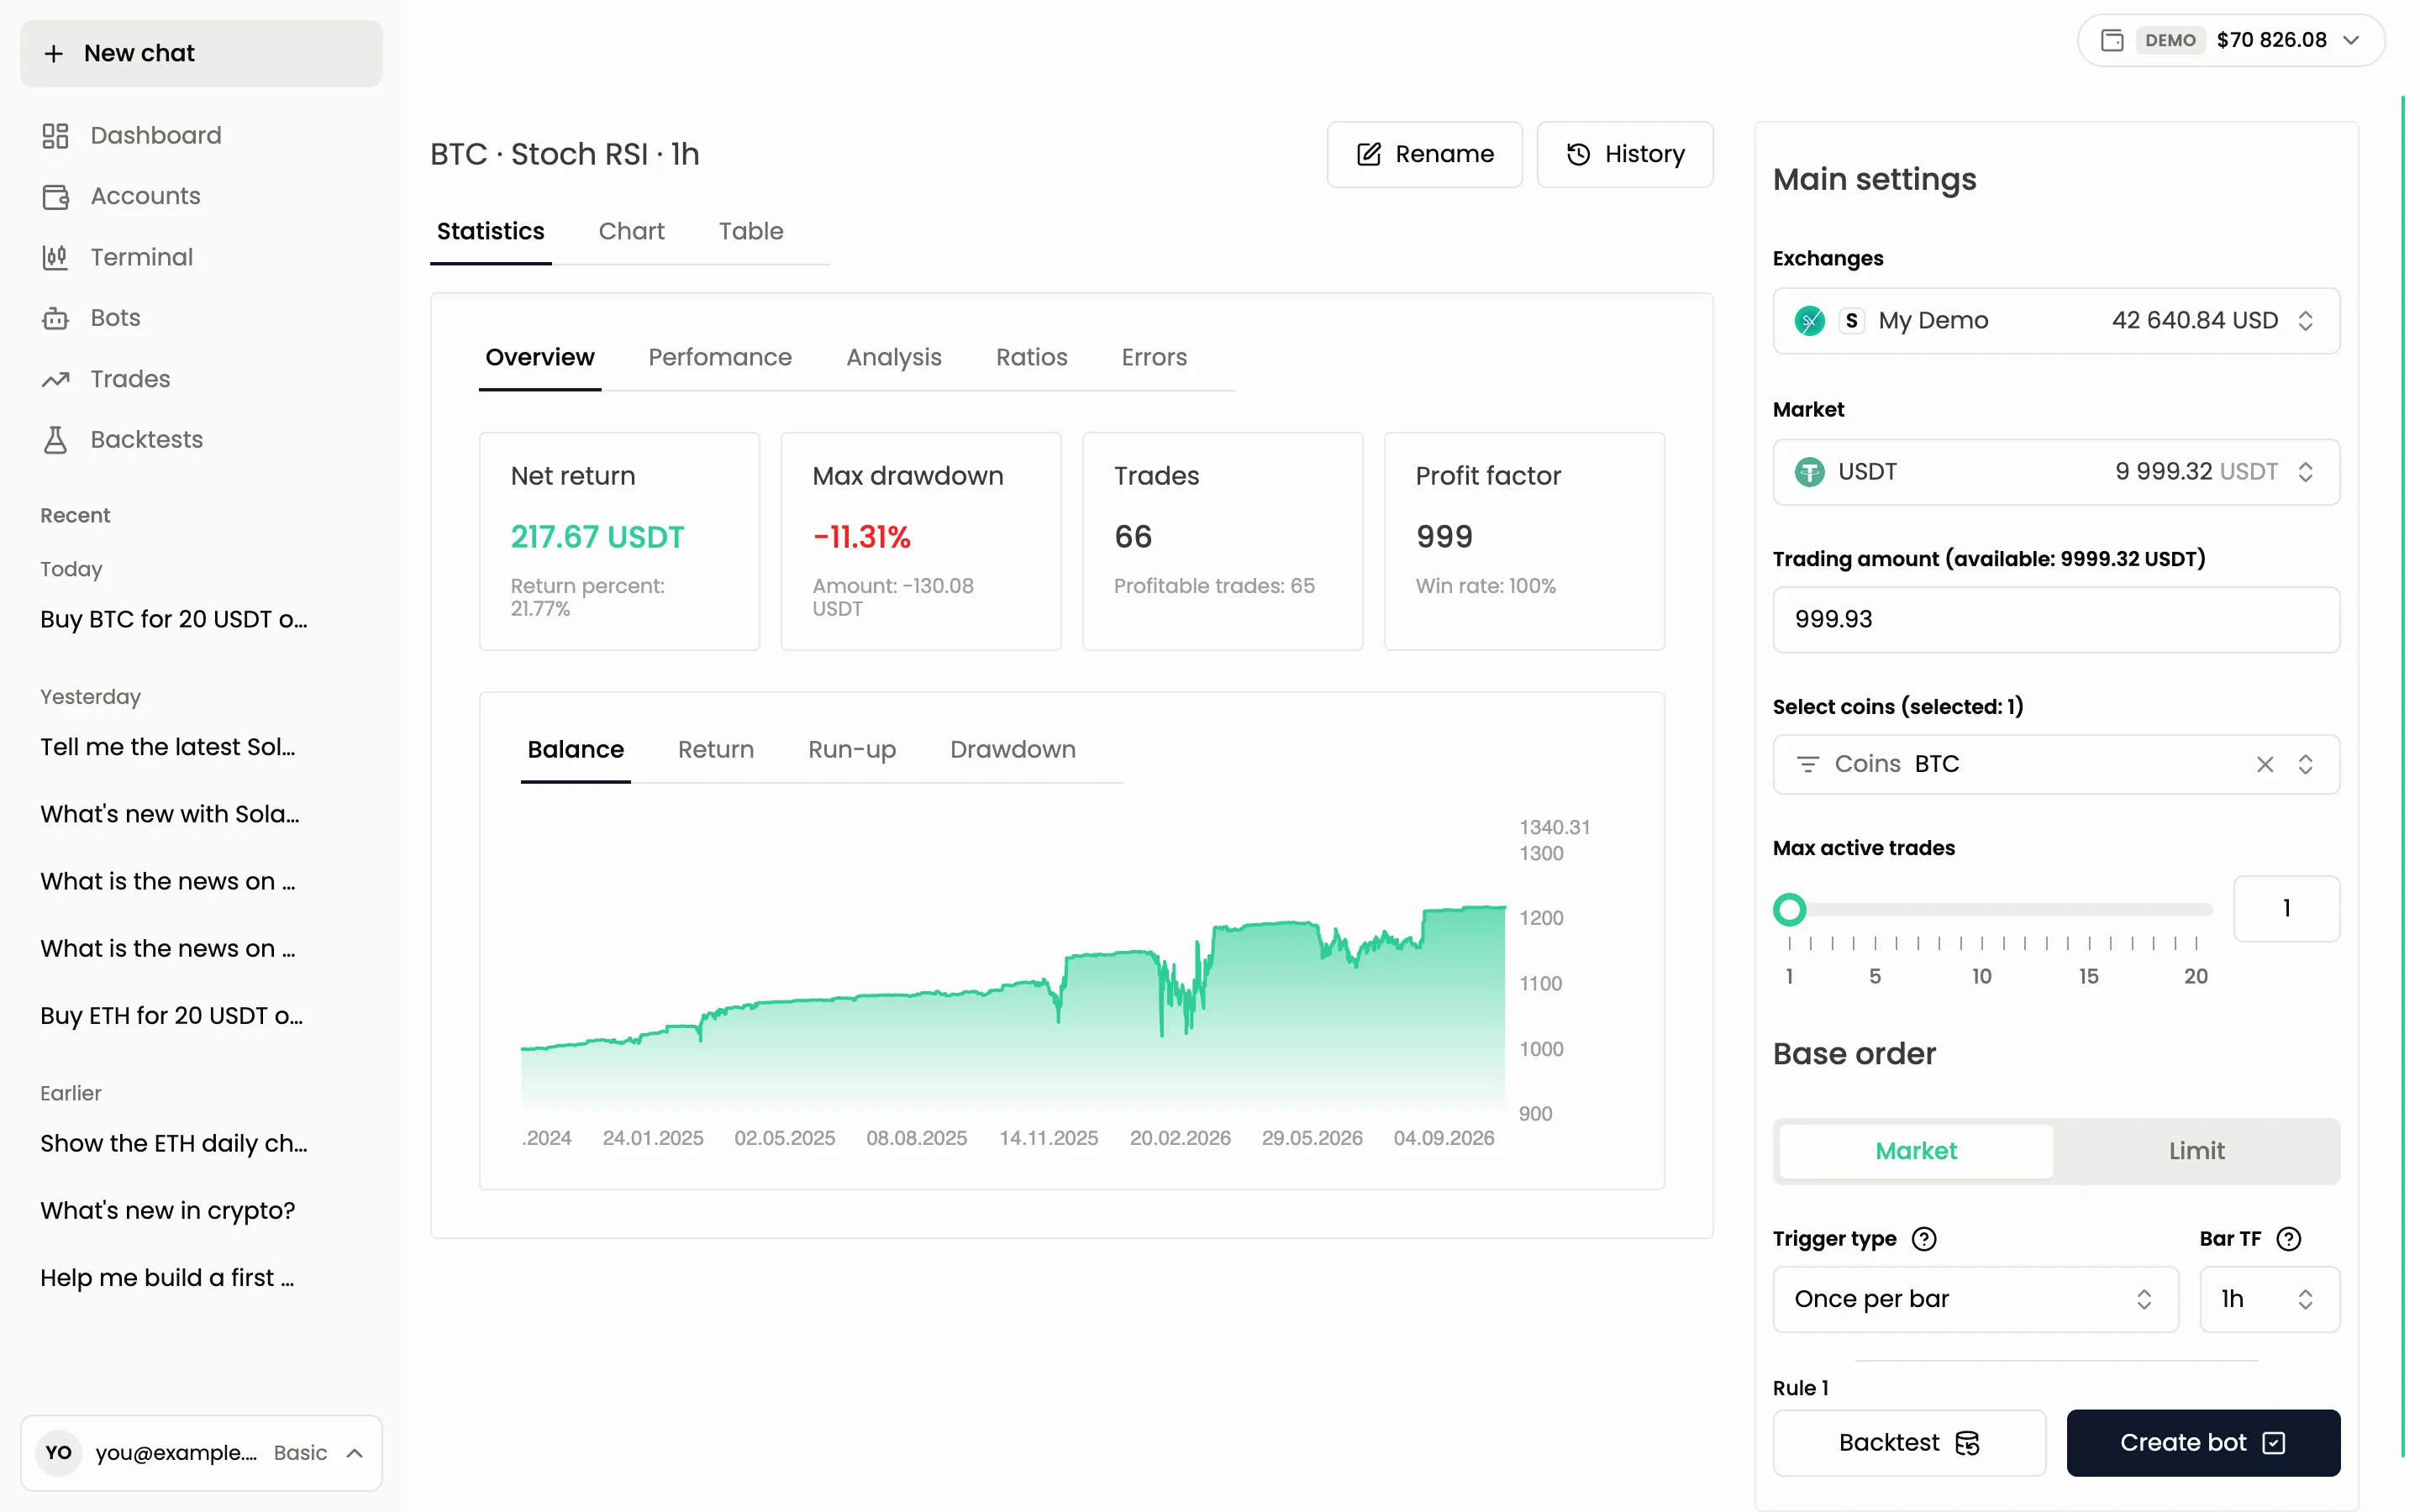
The result has three views, Statistics, Chart and Table, and the statistics are split into the tabs Overview, Perfomance, Analysis, Ratios and Errors. The agent can read the same numbers to you and explain them in plain words.
The main numbers
The Overview tab shows four cards:
| Number | What it tells you |
|---|---|
| Net return | Your result after fees and slippage. This is the number to trust |
| Return percent | Under the net return: the same result as a percent of the trading amount |
| Max drawdown | The biggest fall of the balance from a peak to the next low, with the Amount below. It shows how much pain the strategy can cause on the way |
| Trades and Profitable trades | How many deals the strategy made and how many of them closed in profit |
| Profit factor and Win rate | Gross profit divided by gross loss, and the share of profitable trades |
Fees are already inside
The net return already includes the commission and the slippage. The Perfomance tab shows how much went to fees (Commission paid) and to slippage (Total slippage). If the agent quotes a total return, that one is before fees and slippage and always looks better. Judge the strategy by the net return.
Profit factor can fool you
The profit factor is calculated before fees. A strategy with many small winners can show a profit factor above 1 and still lose money after the fees. Read it together with the net return, not instead of it.
Win rate is not profit
A strategy can win 80% of its trades and still lose money if the rare losses are big. Check the average winning trade and the average losing trade in the Analysis tab.
The ratios
The Ratios tab has risk-adjusted numbers. They help you compare strategies on the same period.
- Sharpe ratio: return per unit of total volatility.
- Sortino ratio: like Sharpe, but counts only the downward volatility.
- Calmar ratio: yearly return divided by the max drawdown.
- Recovery factor: net profit divided by the max drawdown.
- Win&lose ratio: the share of winning and losing trades.
- Profit factor: the same number as on the Overview tab.
If a run lost more than the whole trading amount, the ratios have no meaning. Ignore them in that case.
What the backtest assumes
A backtest is a model. These are its defaults:
- Commission 0.1% per order. You can change it in the parameters.
- Slippage 0.05% on market orders, because a market order rarely fills at the exact price you saw.
- Liquidation on futures uses one maintenance margin rate for all exchanges, so it is optimistic for large positions.
- Funding on futures is assumed to be zero.
- Each deal uses the full trading amount you set, no matter how much the earlier deals won or lost.
The last point has a consequence. The amount is not reduced after a loss, so losses add up and a run can lose more than the trading amount. A result such as -117% means the strategy would have lost more than you allotted. This is a warning sign, and the ratios are then meaningless.
The balance curve, the chart and the table
Under the cards on the Overview tab is a curve with the tabs Balance, Return, Run-up and Drawdown. A smooth line that climbs steadily is better than a line with one huge jump. If almost all the profit comes from one trade, the result is luck.
The Chart view shows the price chart of the coin with your entries, averaging orders, take profits, stop losses and liquidations marked.
The Table view lists every deal and every order with its price, quantity and commission, so you can check how the strategy behaved on a single day.
The Enter & hold return on the Perfomance tab shows what you would have earned by simply buying the coin at the start and holding it. If your strategy does not beat it, the strategy adds nothing.
What a backtest cannot tell you
A backtest is not a promise of future results. It shows how rules would have behaved on past prices. The market changes, liquidity changes, and a strategy tuned to the past can fail on new data.
Some practical habits:
- Test on several periods, including a falling market.
- Do not tune the parameters until the past looks perfect. That fits the noise.
- Start a bot on the demo account, then with a small amount of real money.
Explain the results of my last backtest in simple words and tell me what the risks are
Next: Running a backtest, Strategy builder.
Still have a question?
Ask the agent in the app, or write to support in the chat at the bottom right.