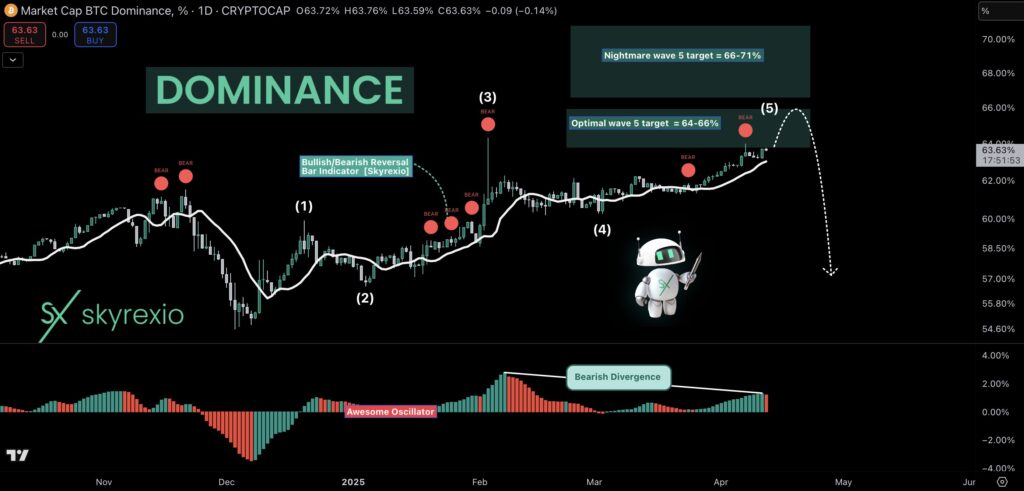
Bitcoin Dominance: My Global Overview
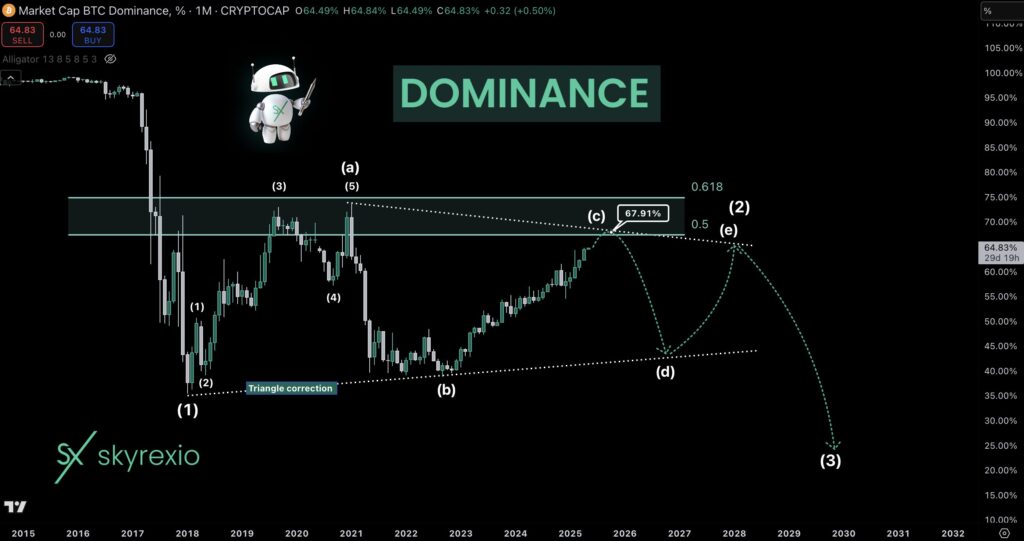
Hello, Skyrexians! Yesterday we made a local update on BTC.D where pointed out that waves order has been changed a little bit, today we will take a look at this chart globally. Soon we can have a great reversal but we will feel pain before it because target above 66% will happen. This is monthly […]
LDO Is The Best Asset Now
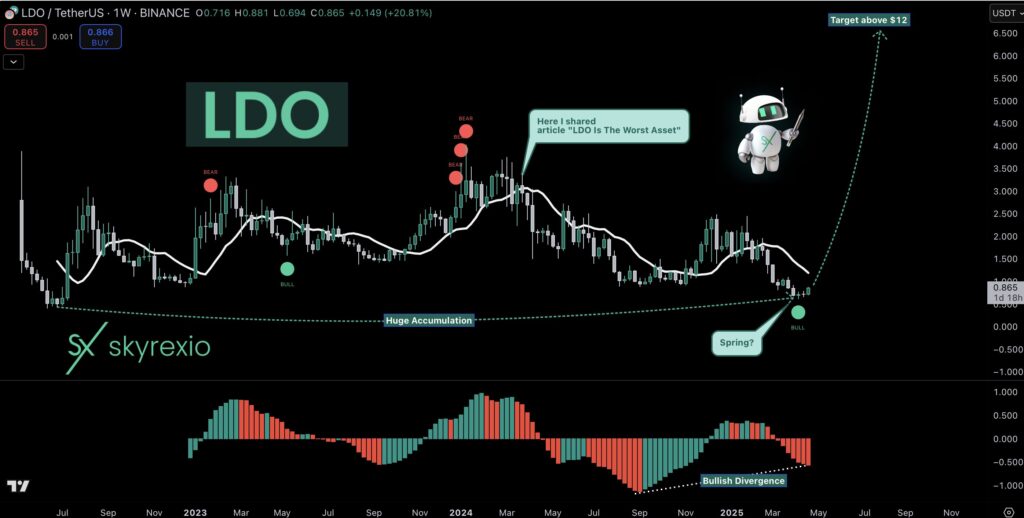
Hello, Skyrexians! Some of you may be remember my article which I shared more than 1 year ago where called LDO the worst asset and it dumped exactly as predicted. Then made a mistake making assumption that some coins can grow while other will go down. This assumption has the very low probability to be […]
Trading Plan For Cardano ADA Revealed!
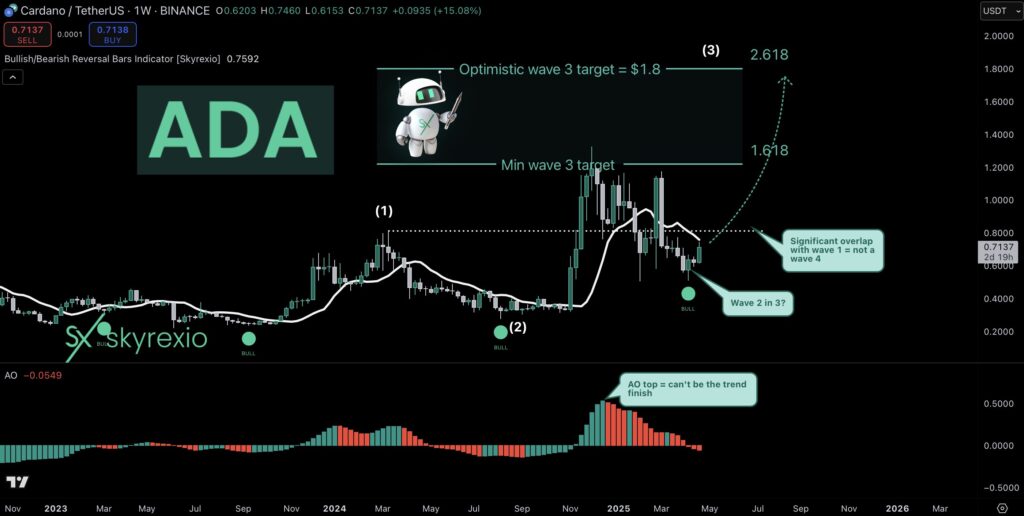
Hello, Skyrexians! I tried multiple times to understand what is happening on ADA chart. The Elliott waves analysis was too complicated and I didn’t share anything, but today I found the scenario which fits with the trading system rules. Let’s take a loot at the weekly time frame. The bull market wave 2 has been […]
SUI Is Entering Into Final Stage Of Bull Market
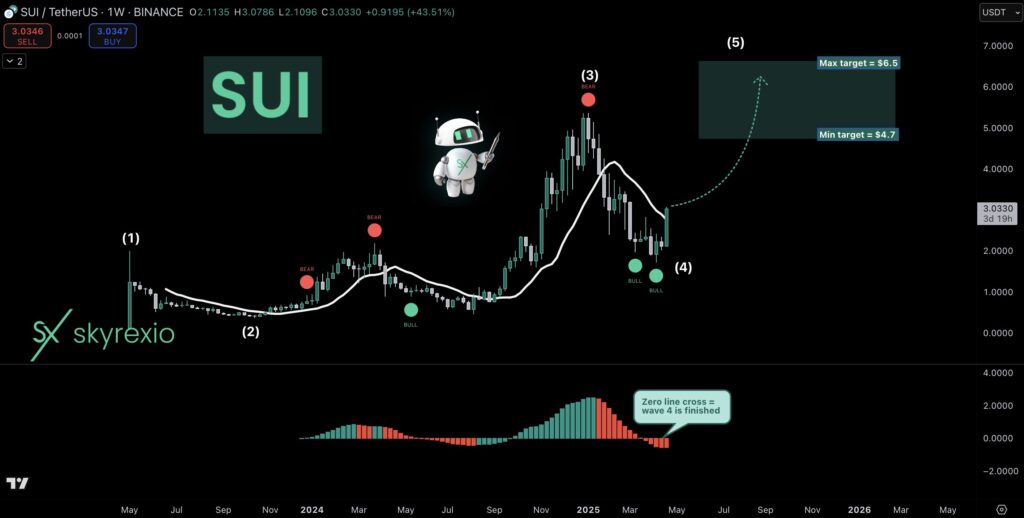
Hello, Skyrexians! On yesterday’s crypto pump SUI was the greatest performer and people started to have an interest in this coin will continue growing or this is just a bull trap. Let’s try to understand it. On the 1W time frame we have unclear, but Elliott wave structure. It looks like wave 4 overlapped with the […]
Bitcoin Dominance Is About To Finish The Growth Cycle
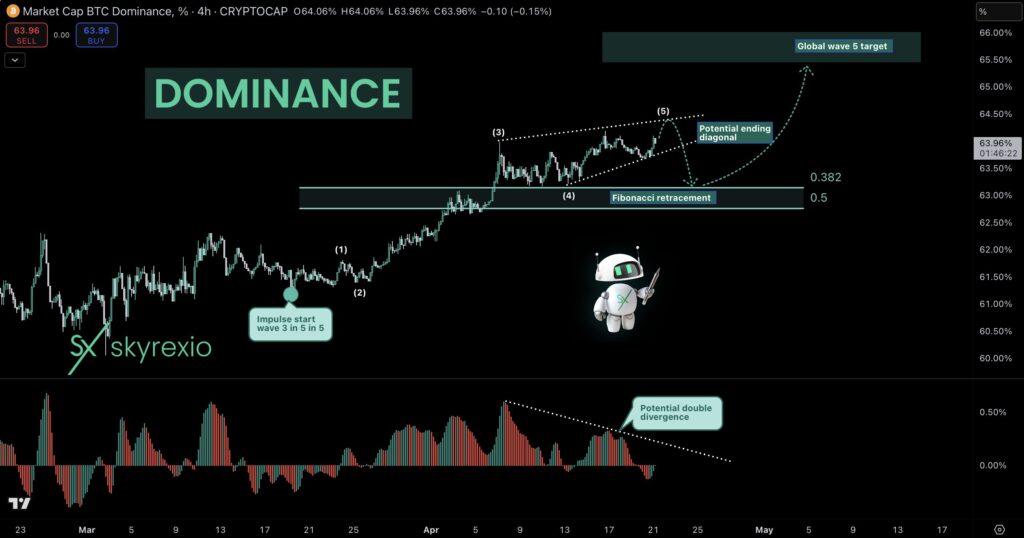
Hello, Skyrexians! Time to update our main chart BTC.D and today we will take a look at 4h time frame to make sure that everything is going according our global scenario. Today we consider wave 3 in 5 into the global 5. It has been almost done with the potential double divergence and ending diagonal […]
Bitcoin Is Entering Into The New Impulse
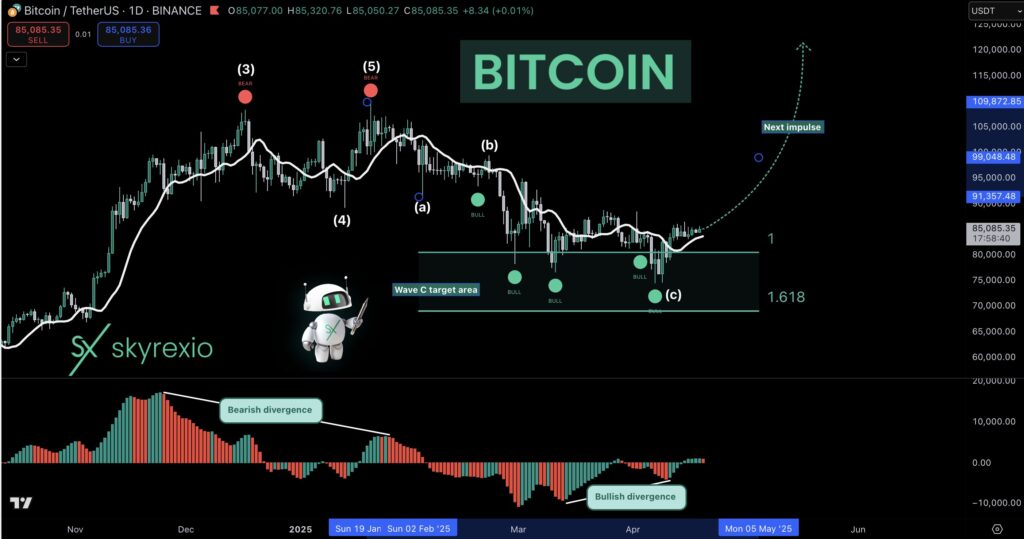
Hello, Skyrexians! We hope you remember our previous BTC analysis where we told you that Bitcoin will not go significantly lower than $77k. Now price is already at $85k and people now can’t understand what is happening. We can see a lot of charts where traders are calling for bear market and further deep dive. On the daily time frame […]
Solana SOL Reveals The Manipulator’s Plan!
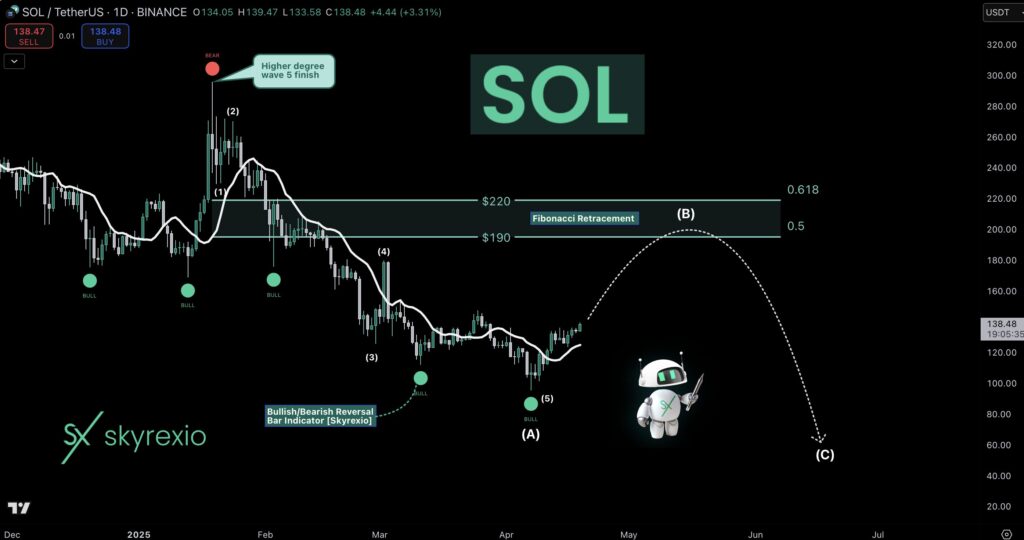
Hello, Skyrexians! It’s time to update SOL analysis. We have already told about Solana dump when price was next to $300 where told about $110 and as usual did not count last wave, but anyway bounce from this area was anticipated. What is next? Recent top was the wave 5 of higher degree, we have […]
Bitcoin Dominance Is Printing The Last Shakeout
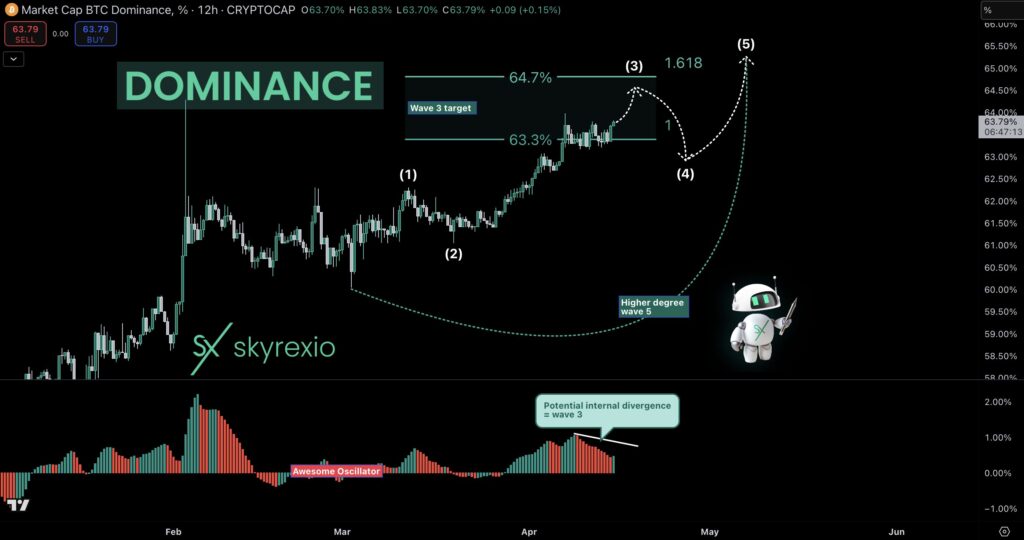
Hello, Skyrexians! Recently we pointed out that BTC.D is in the last bullish wave which has a target approximately at 66% and the bear market on altcoins is almost over. Today we will look in details on this wave inside and try to predict the most precise scenario. Let’s take a look at 12h time frame. […]
PolkaDot DOT Is Ready For Bounce
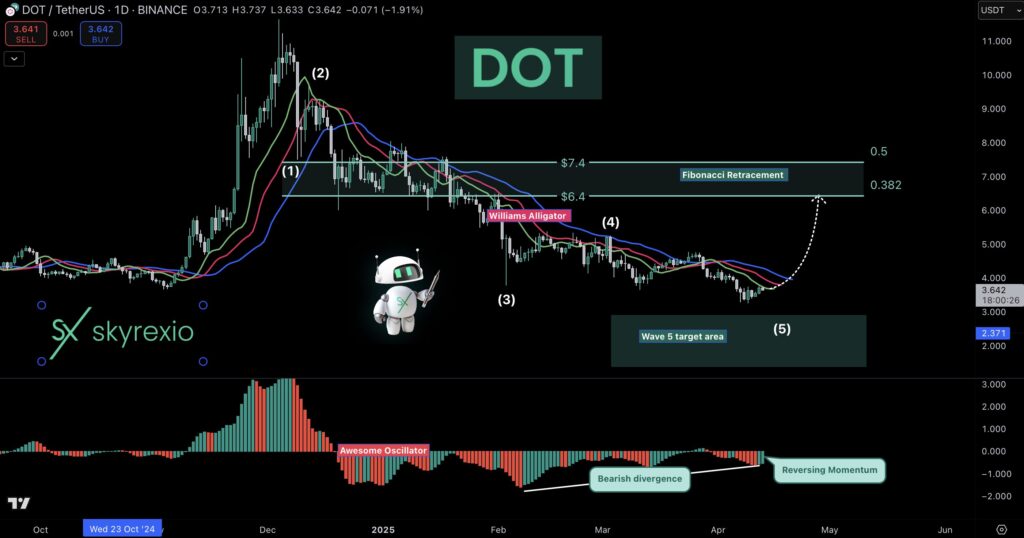
Hello, Skyrexains! Looking at the dominance charts recently we predicted the altcoins run-up in the upcoming weeks and DOT will definitely take part in this bounce. Let’s take a look at the daily chart. Here we cans see that impulse could be already finished. We have 5 waves, true divergence between waves 3 and 5. The […]
Bitcoin Dominance, We Are Waiting For You!
Hello, Skyrexians! We are changing color according to the new upcoming market cycle phase, hope our forecast will be realized and it’s time to be bullish. is about to flash the reversal signal, while altcoins dominance and USDT dominance are already did it, but we don’t also forget about disaster targets. Let’s take a look […]