
Backtests in Trading: How to Backtest Trading Strategies and Avoid Fooling Yourself
Backtests in trading — a complete guide: what a backtest is, how to run one step by step, which metrics to analyze, and 7 mistakes that make a test show profits while real trading shows losses. With examples and screenshots from a real strategy.
What Is a Backtest and Why You Need One
A backtest (from “testing backward”) is a simulation of a trading strategy on historical market data. The trader defines a set of rules: entry conditions, exit conditions, stop-loss and take-profit levels, position size. The software runs these rules against a price archive and generates a report: how many trades were executed, what percentage were profitable, what the maximum drawdown was, and the overall return.
The value of a backtest is not in predicting the future. The market is not obligated to repeat the past. The value lies elsewhere: a backtest filters out strategies that clearly do not work. If an algorithm cannot make money on data where every price move is already known, there is no point in expecting profit under live market conditions.
Backtests in trading solve several practical problems at once. They allow you to evaluate a working hypothesis before committing real money. They help fine-tune strategy parameters — moving average lengths, indicator thresholds, stop widths. They provide an objective picture of risk: not “I think the drawdown will be small,” but a concrete figure for the maximum capital decline over the test period.
Types of Backtesting
Manual Backtest
The trader opens a historical chart, scrolls back in time, and manually identifies entry and exit points according to their rules. Each trade result is recorded in a spreadsheet.
The approach is accessible to anyone — it requires neither programming nor specialized software. However, it is time-consuming, limited in data volume (realistically 50–100 trades can be processed), and prone to cognitive biases, which we will discuss in detail below.
Automated Backtest
Strategy parameters are entered into a specialized platform, which runs them against historical data and generates a report. Testing hundreds of trades takes minutes, not days.
In Skyrexio, for example, the process looks like this: you name the strategy, choose the base asset, specify the exchange commission and testing period, and then launch the simulation.
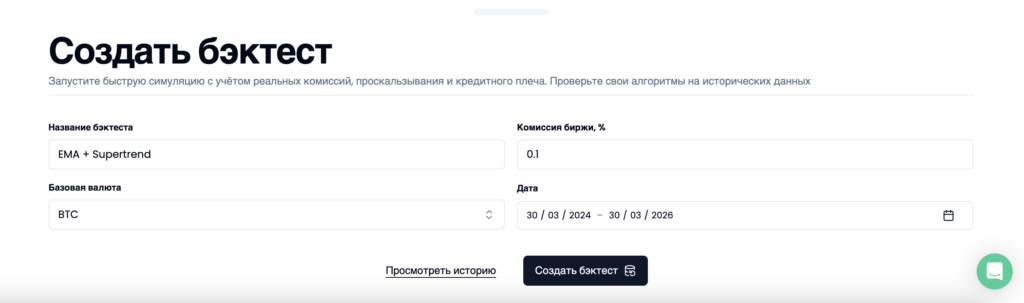
Within a couple of minutes, the platform delivers a detailed report with dozens of metrics, an equity curve chart, and per-trade statistics.
Algorithmic Backtest
The strategy is described in a programming language — Python, R, or Pine Script (TradingView). The code performs all calculations automatically. This approach offers maximum flexibility but requires development skills and is usually overkill for most traders.
Which Metrics to Analyze in the Results
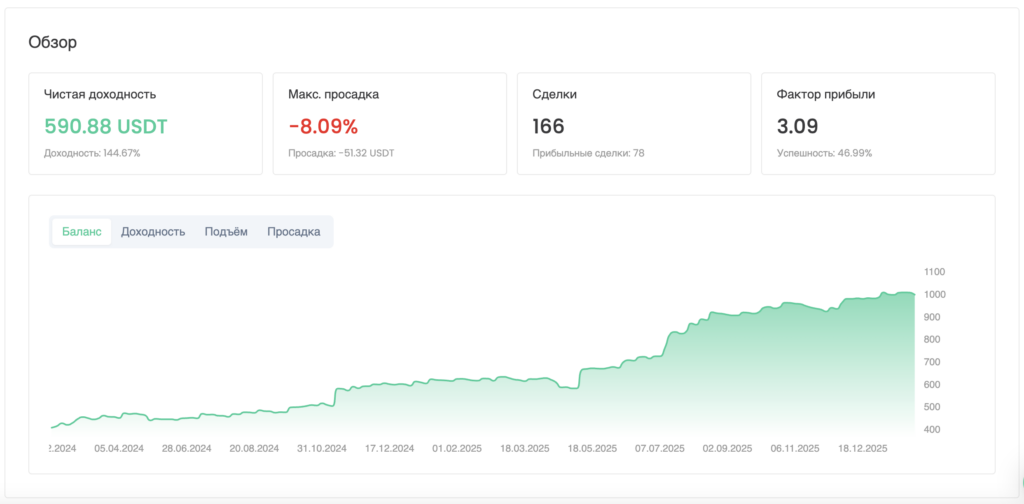
Getting a backtest report is only the beginning. The key is knowing how to read it properly. Let us break down the essential metrics using a real test of the EMA+SuperTrend strategy on BTC/USDT (spot, two years, 166 trades).
Net Return and Benchmark Comparison
The strategy returned +144.67%. However, this number alone says little. Context matters: over the same period, a buy-and-hold strategy for BTC showed -22.46%. The 167-percentage-point gap demonstrates that active management significantly outperformed passive holding over this timeframe.
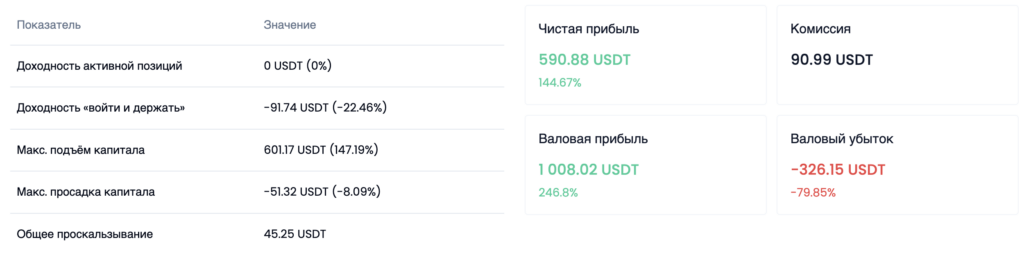
Note the line “Commission: 90.99 USDT.” These are real costs already factored into the final result. Without accounting for them, the return would be noticeably higher — and deceptively optimistic.
Profit Factor
The ratio of gross profit to gross loss. In our example: gross profit 1,008.02 USDT, gross loss 326.15 USDT. Profit Factor = 3.09 — for every dollar lost, the strategy earns three.
Benchmarks: a value above 1.5 indicates a viable strategy, above 2.0 — a good one. Values above 5.0 with a small number of trades are a red flag (likely overfitting).
Win Rate and Average Trade Ratio
The strategy Win Rate is 46.99%. Fewer than half of trades are profitable. Intuitively, that seems bad. But let us look deeper.
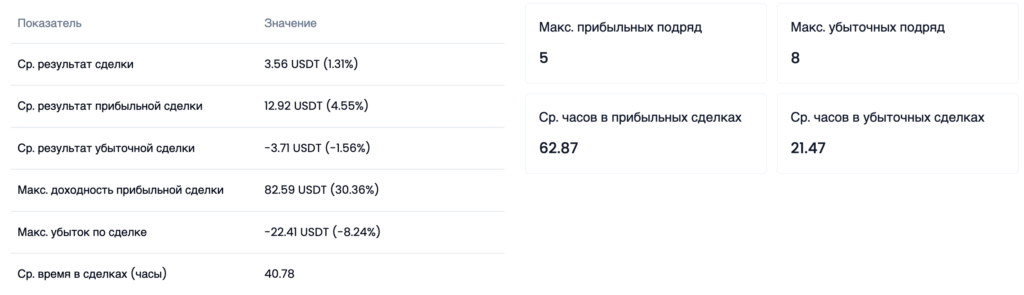
Average winning trade: +4.55%. Average losing trade: -1.56%. The ratio is nearly 3 to 1. The strategy wins less often, but each win is three times larger than each loss. The math favors the strategy — with this ratio, even a 40% Win Rate delivers a positive expected value.
Another telling detail: winning trades are held for an average of 62.87 hours, while losing trades are closed in 21.47 hours. The strategy inherently lets profits run and cuts losses — without emotional interference from the trader.
Ratios: Sharpe, Sortino, Calmar
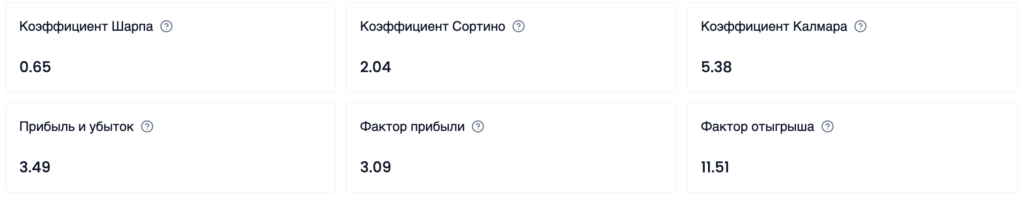
The Sharpe Ratio (0.65) evaluates return adjusted for total volatility. The Sortino Ratio (2.04) considers only downside volatility, which is more informative for traders: a value above 2.0 is considered strong. The Calmar Ratio (5.38) divides annualized return by maximum drawdown — the higher it is, the more efficiently the strategy uses its allowable risk.
Trade Details
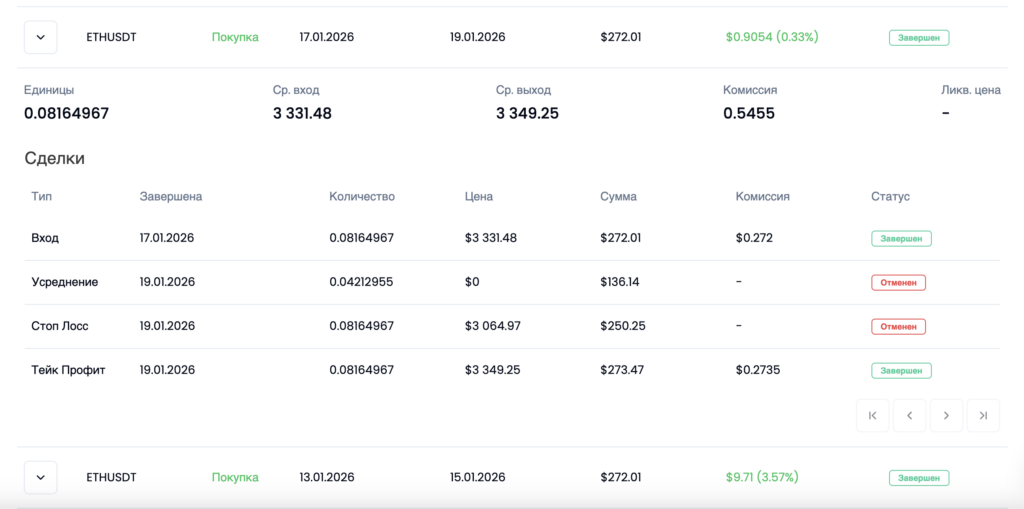
Per-trade statistics allow you to examine each trade individually: entry point, exit point, averaging, triggered stop or take-profit, and commission size. This level of detail is unavailable with manual testing.
Trade Visualization on Chart
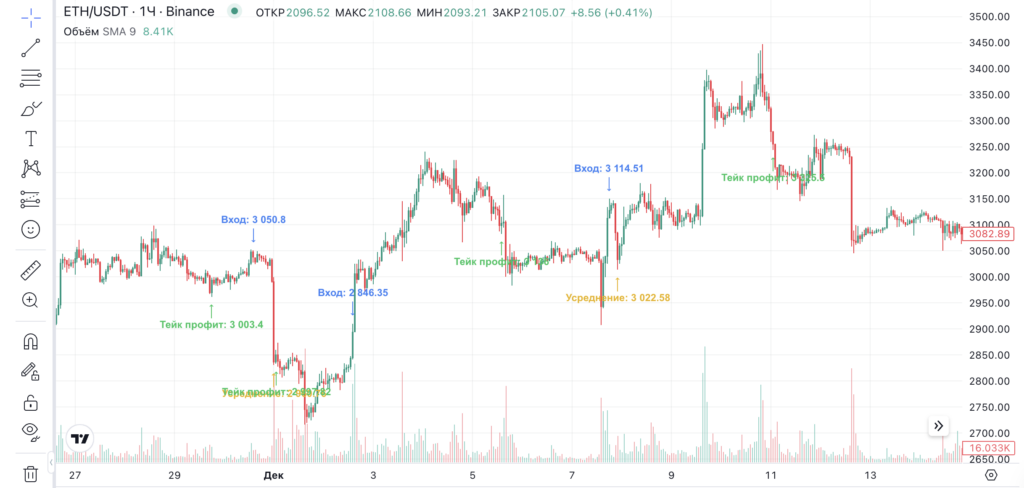
Backtest trades can be overlaid on a chart — this allows you to visually assess how well the strategy logic aligns with market movements and quickly identify segments where the algorithm performed poorly.
7 Mistakes That Distort Backtest Results
Now that we have analyzed the metrics and understand how to read the report, let us move on to what can render all this analysis meaningless — mistakes that turn a backtest from a useful tool into a source of false confidence.
1. Backtesting Without Accounting for Commissions and Slippage
Every entry and exit costs money. Spot commission on most exchanges ranges from 0.05% to 0.1% per trade. At first glance, it seems trivial.
But in our example, 166 trades over two years cost 90.99 USDT in commissions — with a starting capital of ~400 USDT, that is a significant share. Add slippage: another 45.25 USDT. A total of ~136 USDT in real costs, already built into the result.
A backtest that ignores these costs inflates the final return by tens of percentage points. A strategy showing +25% without commissions can easily turn negative after they are deducted — especially with a high number of trades.
2. Parameter Overfitting
You tweak the strategy, get a moderate result. Adjust one parameter — better. Another — even better. After an hour of tuning, the screen shows Profit Factor 7.0 and Win Rate 82%.
In reality, you have taught the algorithm to perfectly replay a specific piece of the past. It has memorized every anomaly on the chart. On new data, all of this is useless.
Signs of overfitting: Profit Factor above 5.0 with a small number of trades; Sharpe Ratio above 4.0 on a sample of fewer than 200 trades; a minimal parameter change (±10–20%) destroys the result.
In our test, the Profit Factor of 3.09 on 166 trades is a realistic, not a curve-fitted result.
3. Testing on Too Short a Period
The crypto market is cyclical: a bullish phase gives way to a bearish one, followed by consolidation. A strategy tested on only one phase is useless for the others.
The minimum horizon is one and a half to two years. The EMA+SuperTrend test covers March 2024 – March 2026 and includes BTC all-time highs, deep corrections, and months of sideways movement. All these phases are clearly visible on the equity curve.
Testing on the last three months of a bull market is a test not of the strategy, but of the ability to buy in a rising market. Any algorithm can do that.
4. Look-Ahead Bias
During a manual backtest, the trader scrolls through a historical chart and marks entries. Formally, they are only looking at the past. But the brain has already seen the right side of the chart and unconsciously filters out unfavorable signals.
A manual test of the same strategy almost always shows 20–30 percentage points more than an automated one. This is not cheating — it is a cognitive bias that cannot be controlled by willpower.
An automated backtest completely eliminates this problem: the algorithm processes candles sequentially, with no access to future prices.
5. Survivorship Bias
If you test a strategy on today’s top-50 crypto assets, you are testing on winners. Coins that were in the top 50 two years ago but have since gone to zero or lost 95% are not in your test.
This systematically inflates the result. To reduce the distortion, focus tests on assets with a long history and stable liquidity — BTC, ETH.
6. Focusing on Returns Instead of Drawdown
Two strategies: A delivers +100% with a -45% drawdown, B delivers +60% with a -8% drawdown. Mathematically, A is better. In practice, it almost certainly fails: a trader seeing their capital halve intervenes and locks in the loss at the worst point.
The real drawdown is typically 1.5–2 times deeper than the backtest. If the test showed -8%, prepare for -12–16%. If it showed -30%, prepare for -45–60%.
Our test recorded a drawdown of -8.09% and 8 consecutive losing trades. Knowing this in advance, you will not panic on the fifth losing trade.
7. No Forward Test
A backtest checks: “Did the strategy work in the past?” A forward test checks: “Does it work on data it was not fitted to?”
Split the available period in two. Use the first part to develop the strategy. Use the second to verify without changes. If the results are comparable, the strategy has a real edge. If they sharply deteriorate, you are looking at overfitting.
How to Backtest Properly: A Checklist
Each point stems from a specific mistake made in practice.
Testing period — at least one year, with mandatory inclusion of different market phases.
Minimum trades — at least 100. With fewer trades, the statistics are unreliable.
Cost accounting — commissions and slippage must always be included, no exceptions.
Robustness check — parameters ±20% should not destroy the result.
Forward test — mandatory verification on data not used during development.
Drawdown priority — evaluation starts with drawdown, not return. Multiply by 1.5–2 and honestly assess your readiness.
All screenshots and data in this article were produced in Skyrexio. On the platform, you can build a strategy in a visual constructor without writing code, run a backtest with real commissions and slippage, and then launch the same strategy for automated trading on the top 10 crypto exchanges. The full cycle — from idea to live trading — in a single tool.
Summary
A backtest is not proof of profitability. It is a filter that weeds out non-working strategies. A reliable filter — if it is conducted without mistakes.
Before launching a strategy with real money, ask six questions: Does the test cover at least two years? Are there more than 100 trades? Are commissions accounted for? Is the Profit Factor in a realistic range (1.5–4.0)? Are the parameters robust to changes? Has a forward test been passed?
Six “yes” answers — grounds for a cautious launch with a minimum position. Fewer than six — a reason to refine the strategy.