ADA – re-enter long position
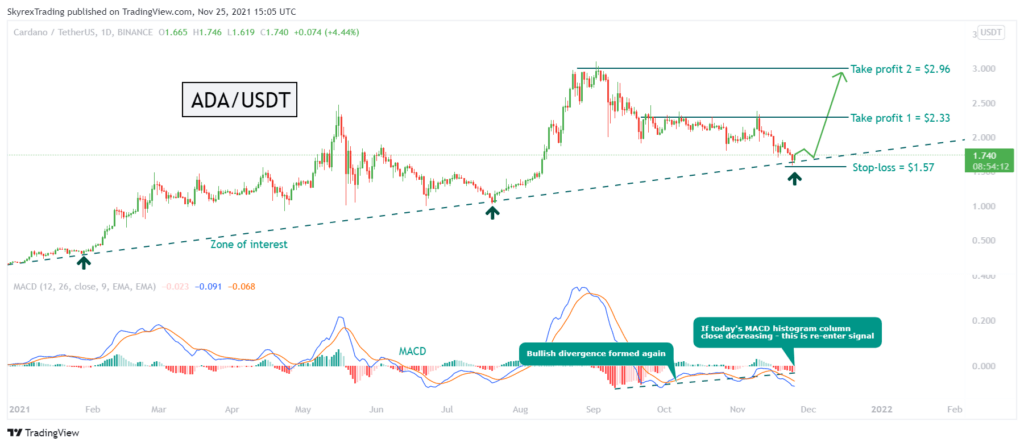
I told you that if you trade divergences, you should be able to exit and re-enter position if the new divergence forms.
Bitcoin – local pump before crash!
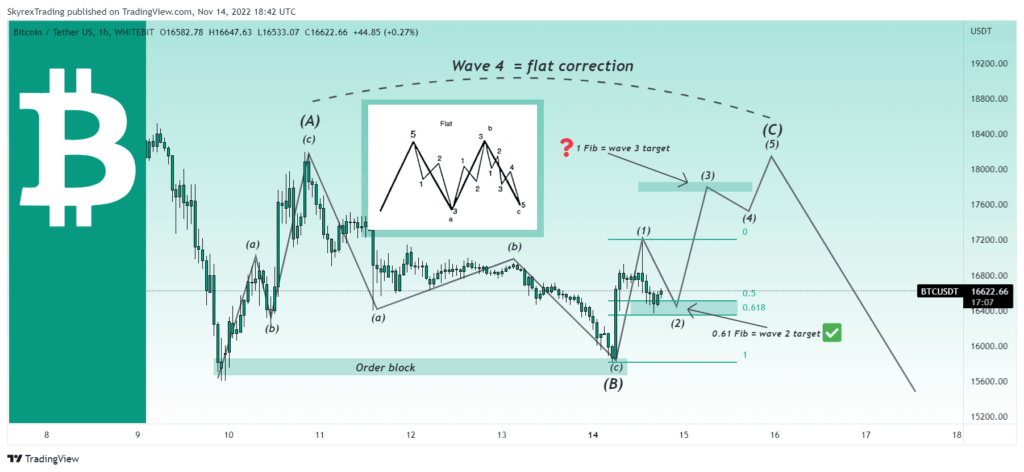
Yesterday my short setup started doing pretty well, but when I woke up the price immediately pumped and reached the entry level. Hello, everyone! Yesterday my short setup started doing pretty well, but when I woke up the price immediately pumped and reached the entry level. Today I decided to close my short at the […]
Bitcoin – insane long very soon!
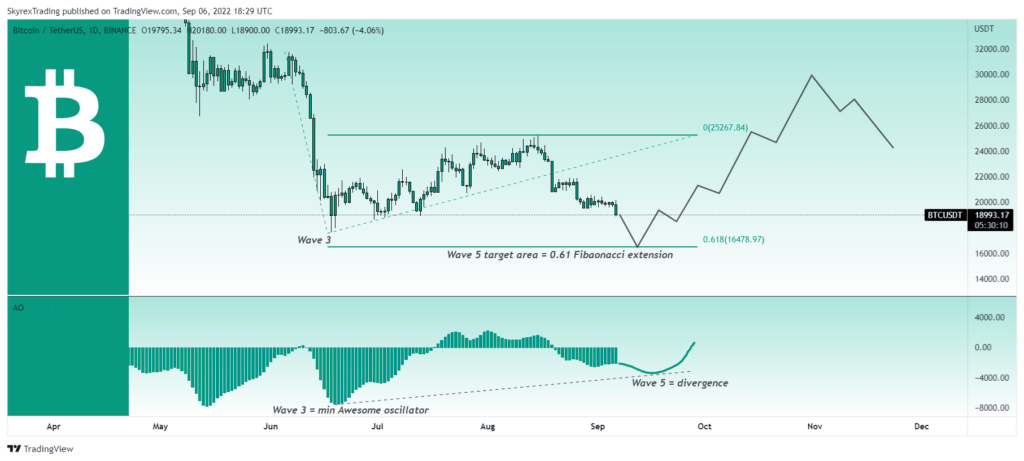
I accumulate the positions because believe that next 2-3 months Bitcoin will reach $30k.
Bitcoin – decisive move very soon!
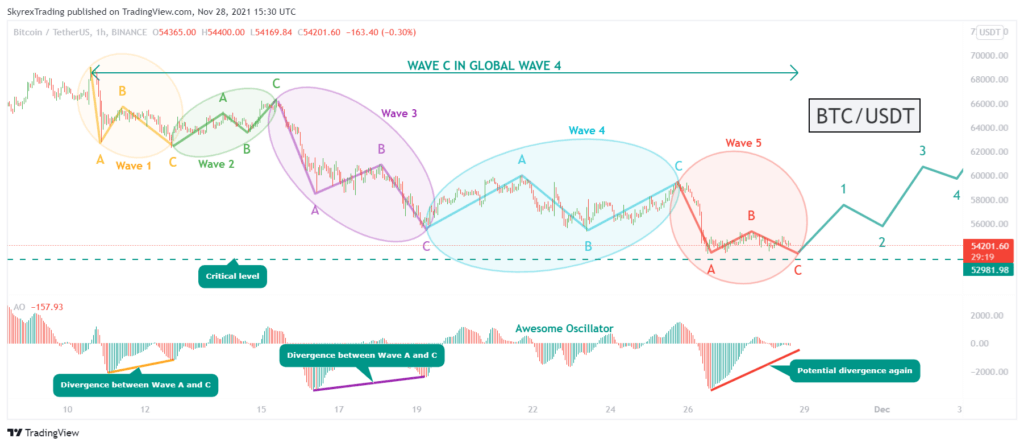
You can see on the chart the A-B-C structure of each of five waves. If we take a look at the impulse waves 1 and 3, the subwaves A and C always form the divergence with the Awesome Oscillator.
Bitcoin – too fearful, but still bullish!
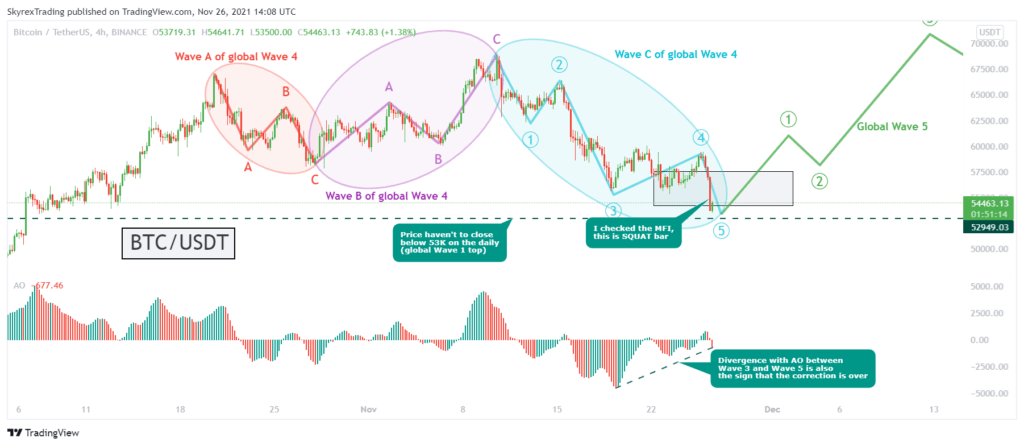
We have 3 factors that the correction is over, but this is the real market and everything is possible!
Navigating the Ongoing Crypto Bull Market: Insights and Strategies

In this article you will know what is the targets for Bitcoin, Ethereum and Binance coin for the bull market and how to earn money with low risk.
Bitcoin – Wyckoff accumulation is almost completed!
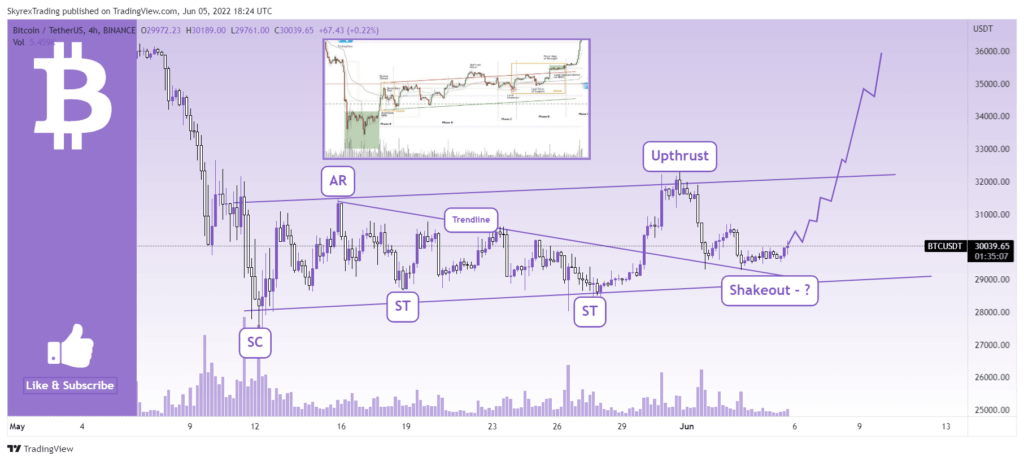
We can see that the trading range is clearly formed as the upward trend channel. All the Wyckoff events are also you can find on the chart.
TWT – distribution phase!
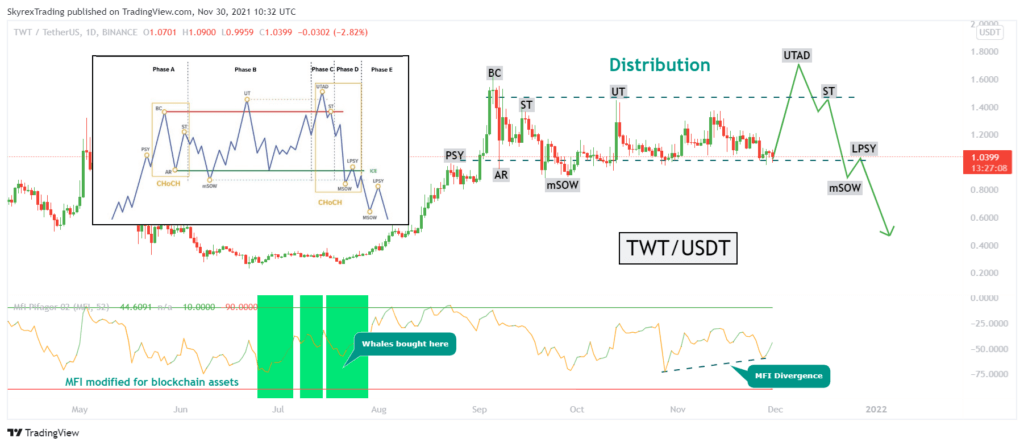
We considered the Bitcoin price analysis here and assumed that we will see the price growth soon. According to this I found very interesting pattern for TWT.
Bitcoin – two only possible scenarios!
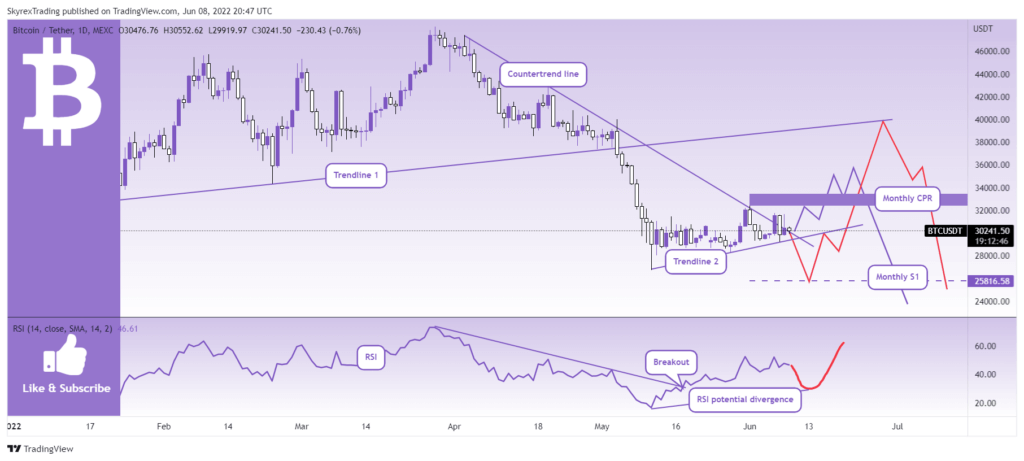
I am absolutely sure that one of these scenarios is going to plays out. I know that all of you tired of the current sideways.
Bitcoin – my intraday trade revealed!
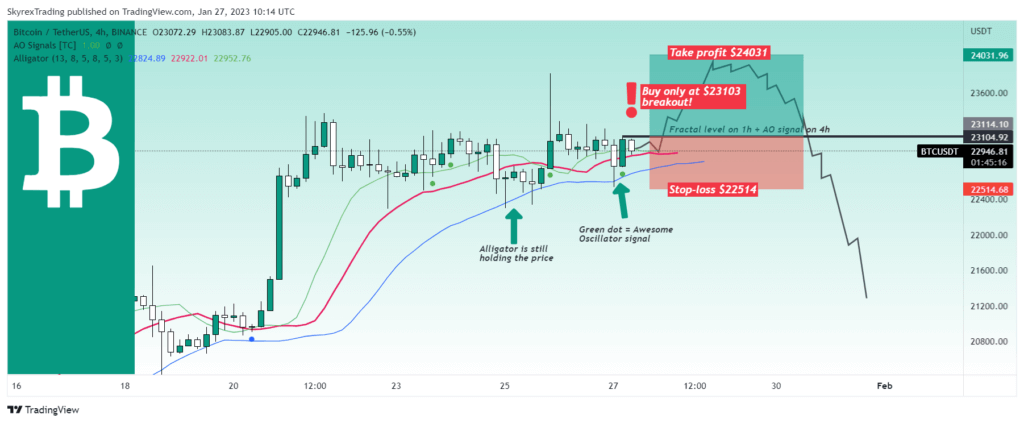
On the 4h time frame BTCUSDT chart we can notice that the price is still above the Williams Alligator indicator, it means that the overall bias is still the bullish.
