Ethereum ETH Will Go Insane Soon!
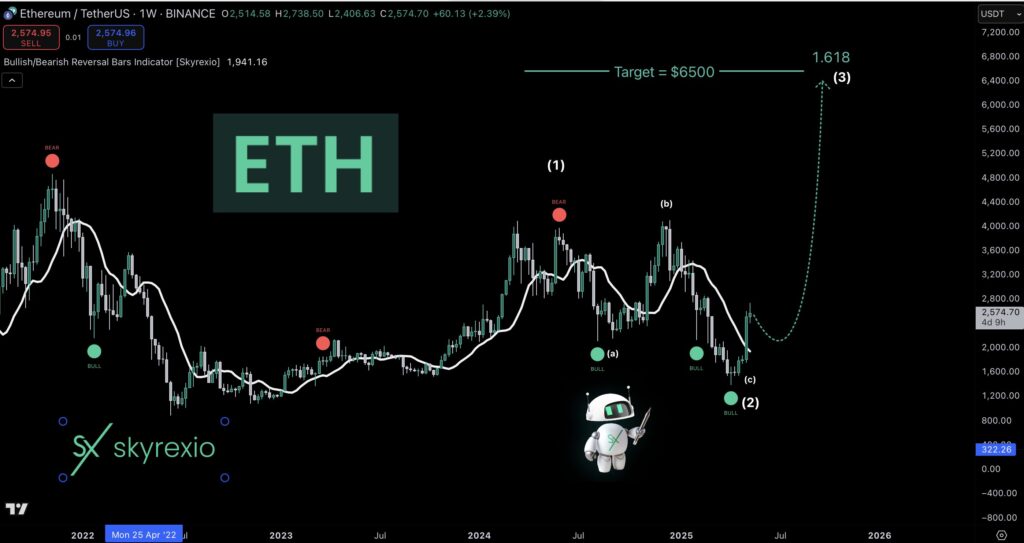
Hello, Skyrexians! It’s not a top secret that Bitcoin dominance is about to finish the uptrend and it can give the second life to ETHUSDT . We have already seen the bounce, but now asset is struggling to break through $2600. We can really see small correction in the upcoming week, but finally uptrend has been […]
Altseason Has Been Started (But I Am Not Sure…)
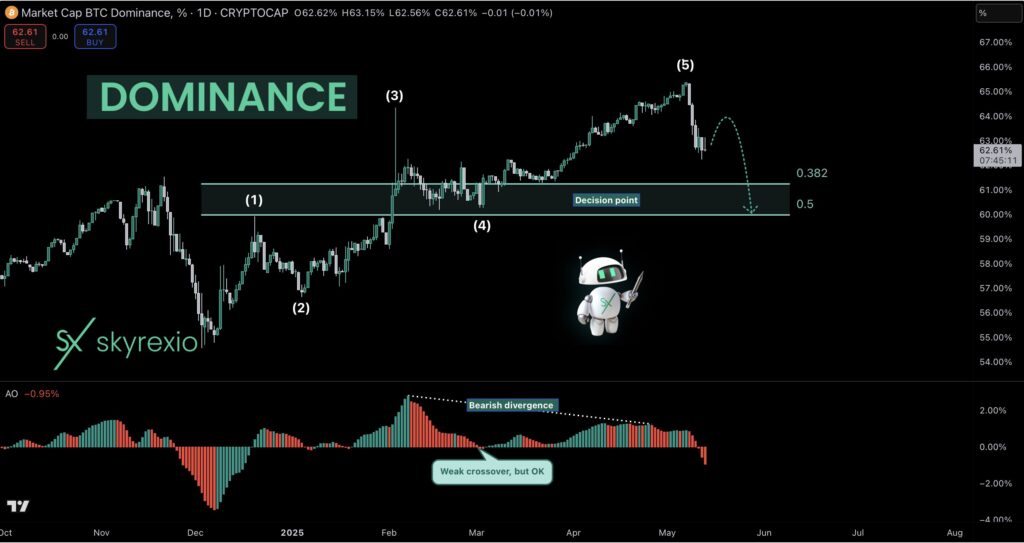
Hello, Skyrexans! Let’s carefully make update on BTC.D because previous analysis where I bet for local top slightly above 65% is playing out even stronger than I supposed. Today I will show you why altseason could be already started, why I am not sure and where is the critical level. Earlier I told that daily […]
Bitcoin BTC Is Entering Into Correction
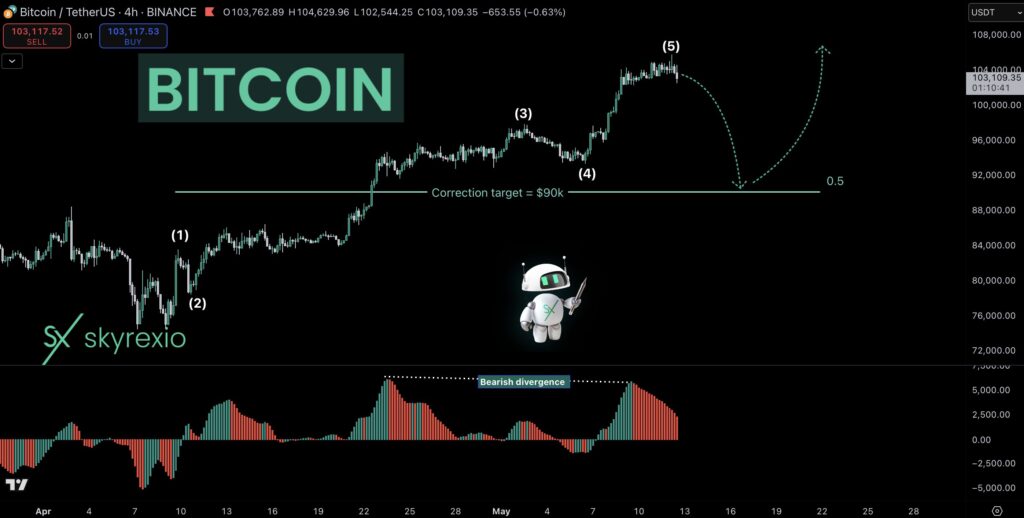
Hello, Skyrexians! I got a lot of comments to analyze BTC because it has almost reached ATH and people don’t understand what is happening. In my opinion last pain ahead and after that likely we see great gains. Let’s take a look at 4h time frame. We can finally notice the full 5 waves cycle […]
Bitcoin Dominance Important Update
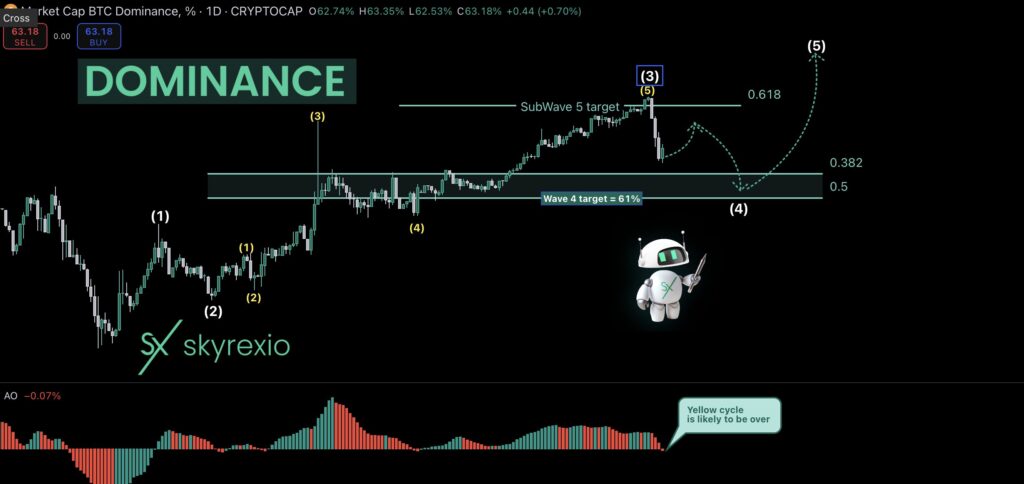
Hello, Skyrexians! BTC.D showed rapid decrease and as a result we have some changes in the analysis. Hope you remember the yellow Elliott waves cycle which according to my previous analysis was not finished. But now looking at the Awesome Oscillator I changed my mind and now we in the higher degree wave 4. We […]
PolkaDot DOT Let’s Wait Agains The Crowd
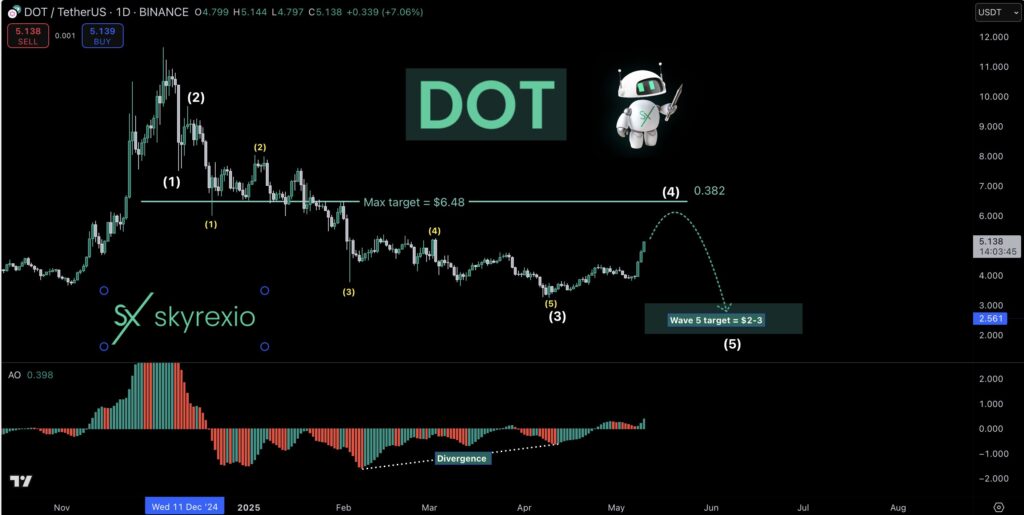
Hello, Skyrexians! As I mentioned in the recent DOT analysis the bounce to approximately $6 was predictable and very likely. Now it’s happening. Green candles caused a lot of greed again, yesterday I checked the sentiment sharing some bearish minds in Tradingview and got a lot of negative. What’s a pity, but the market again […]
Bitcoin Dominance: Don’t Be So Optimistic
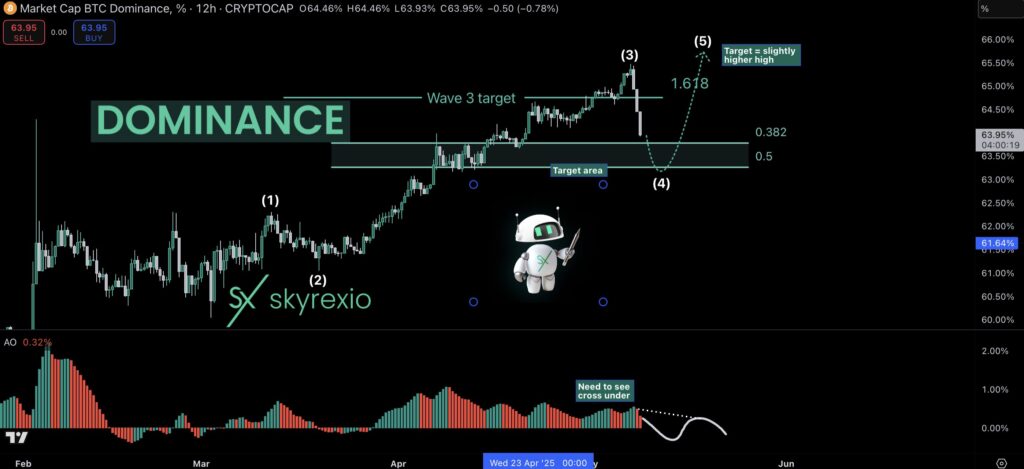
Hello, Skyrexians! My previous BTC.D forecast now is playing out well. I bet for the reaching 65.35% before drop, we have seen 65.5% which is almost the same. Now dominance is dumping, but I warned you it’s not the end. Now I will give you small update. I will not cover higher degree waves, you […]
BNB Is Entering Into Final Stage Of Bull Run
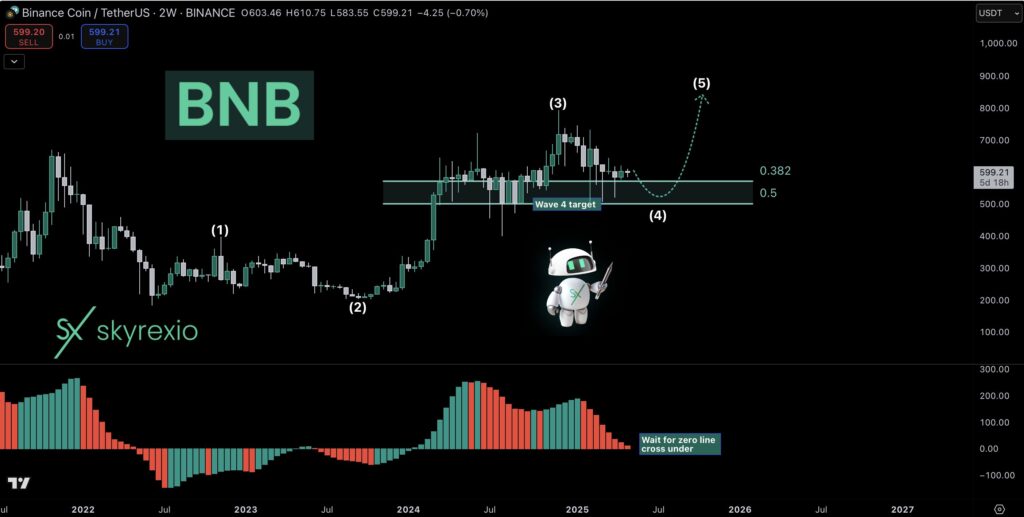
Hello, Skyrexians! BNB is the rare asset which showed the bull market with the Bitcoin and set the new ATH. Like Bitcoin BNB is also about to show us the final growth wave. On the 2 weeks time frame we can see how this bull market has been developing. Awesome Oscillator gives us a hint […]
Did Small Cap Altcoins Bottomed In?
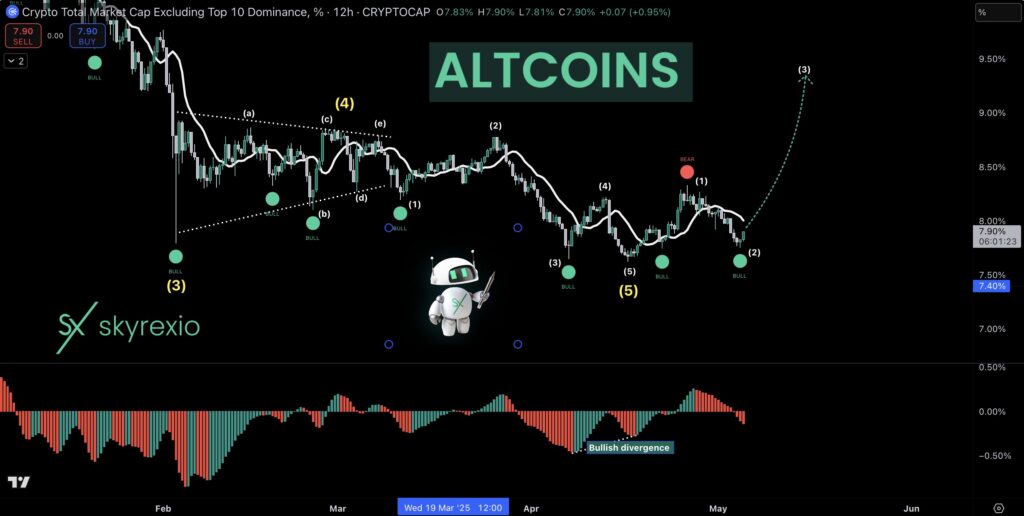
Hello, Skyrexians! It’s not a secret that we are waiting for Bitcoin dominance drop to at least 62% right now, but after that we expect the final shakeout to 67%, but the OTHERS.D gave us a hint that may be this shakeout will not affect on low cap alts that much like on top-10. Let’s […]
Ethereum ETH Is Gaining Strength Agains Bitcoin
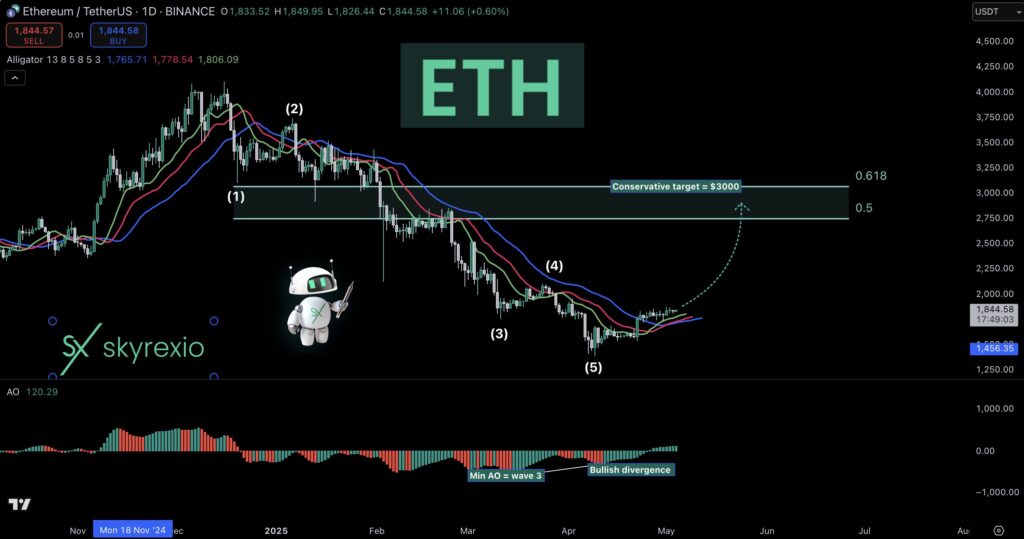
Hello, Skyrexians! ETH was a huge underdog last 4 month on the bearish phase, but recently it started to gain power, on the recent dump it has not showed correction. On the daily chart we can see that price has printed 5 waves Elliott cycle. Wave 3 corresponds to the minimum Awesome oscillator. After that […]
Bitcoin BTC Has Started Correction
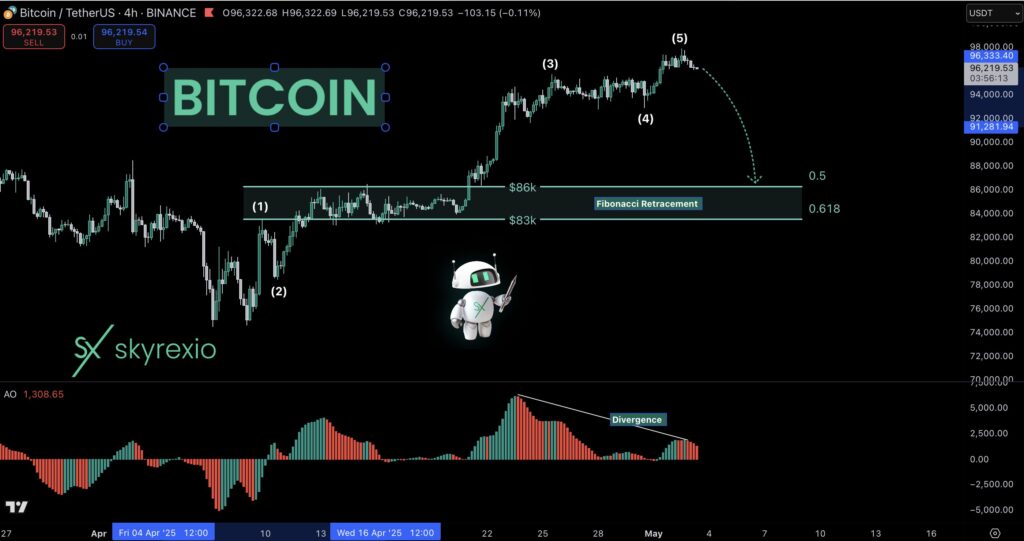
Hello, Skyrexians! Hope we understood what is going to happen with the Bitcoin dominance, if briefly we are waiting for correction and this dominance dump will likely happen on BTC dump. Let’s take a look at the impulse which has been started at $75k, it looks like this impulse has been finished already with the 5 Elliott […]
