Profitunity – Beginner [TC]
This indicator aggregates the knowledges of the first level of the Trading Chaos approach by Bill Williams .
Bitcoin – fake pump ahead!
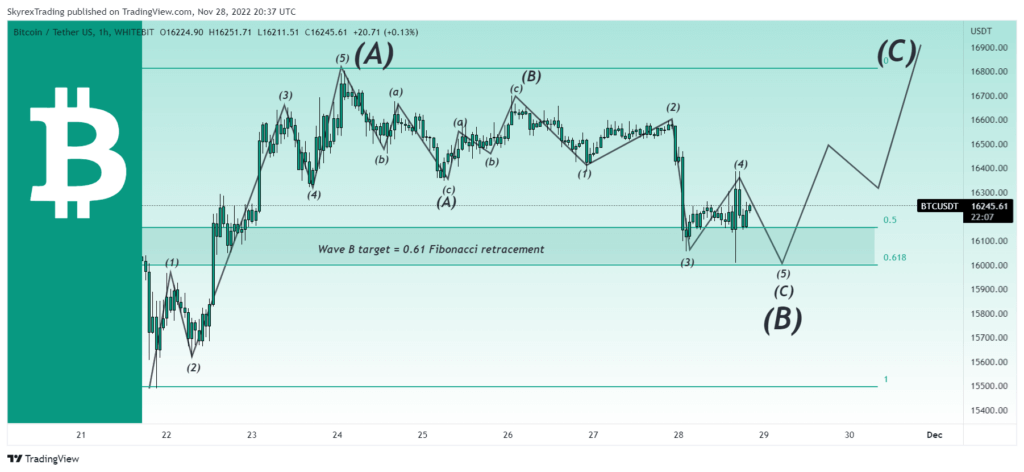
Target zone have been reached – Fibonacci retracement 0.618, but we have to wait for another one leg down – wave 5. After that I anticipate the push to the $17800.
Bitcoin – bullish rally will continue!
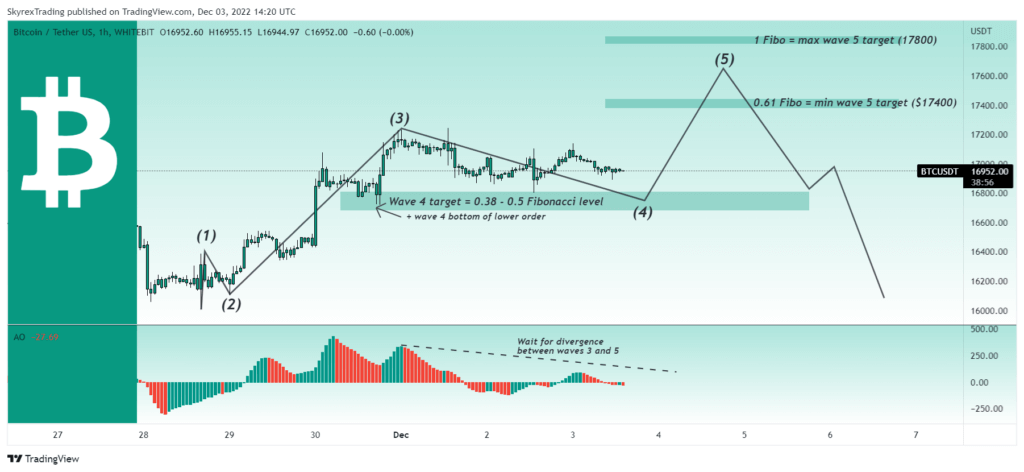
In my last Bitcoin analysis I told you that the rally in the corrective wave C have been finished and I opened short at $17100.
Bitcoin – bears dominate until it has not broken this level!
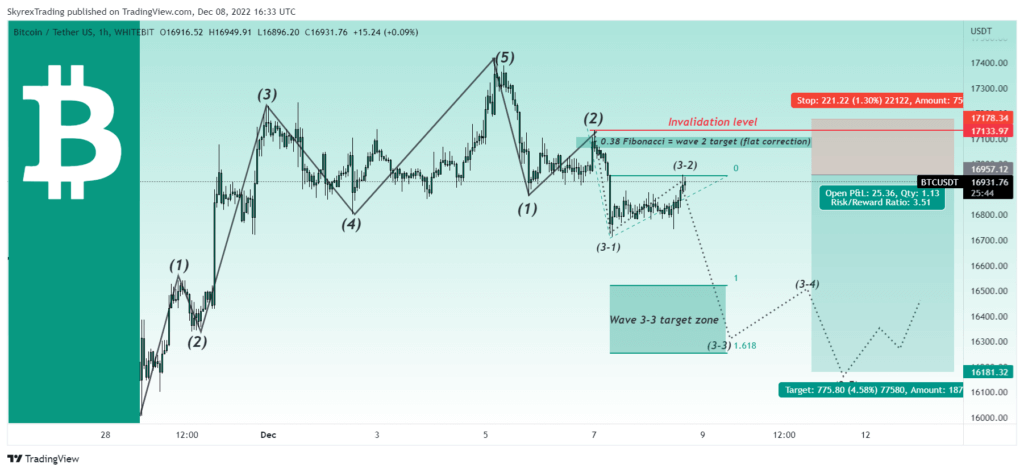
My last call was quite accurate, after trendline resistance Bitcoin has started it’s dump, but today it faced with difficulties to break down the strong support.
Bitcoin is moving exactly as predicted!
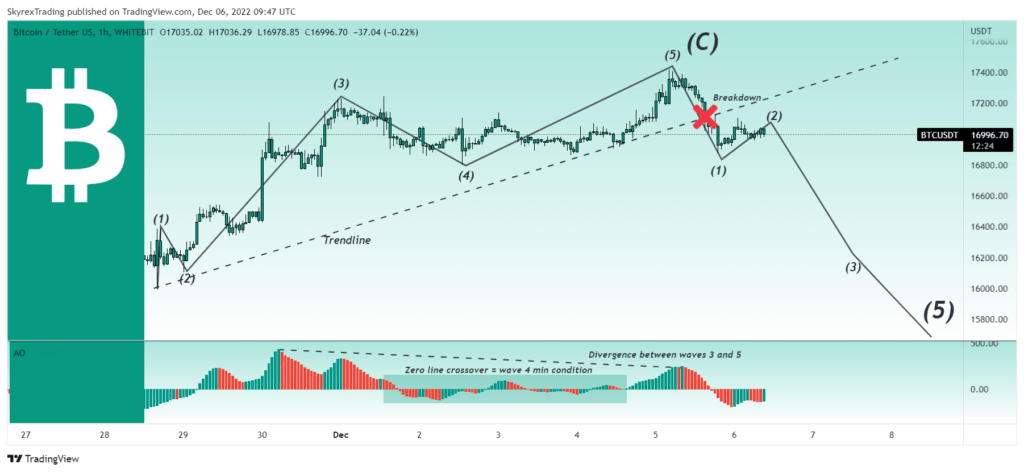
It is the best motivation for me to continue studying and practicing this approach and I hope my articles are useful for you.
Bitcoin is still bearish!
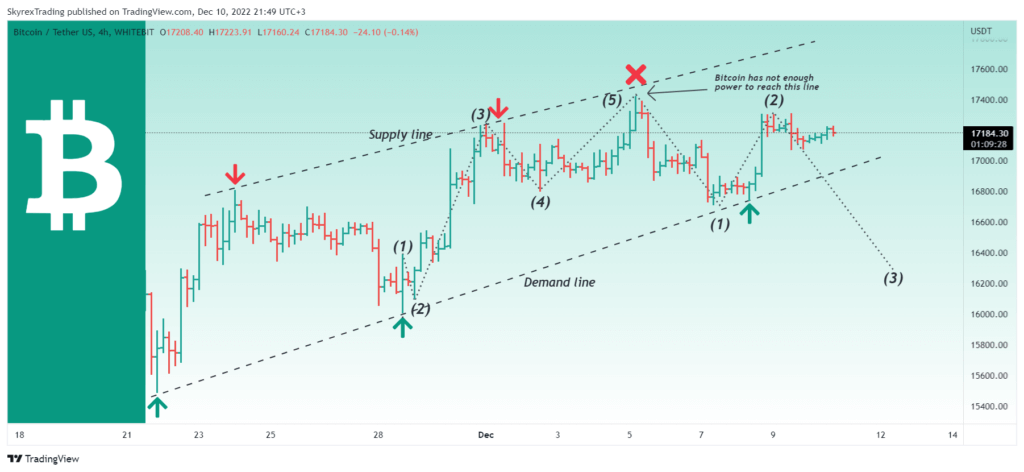
You can laugh on me that I was sure that the Bitcoin price is not going to break $17080, but it did.
Bitcoin is on the edge of collapse!
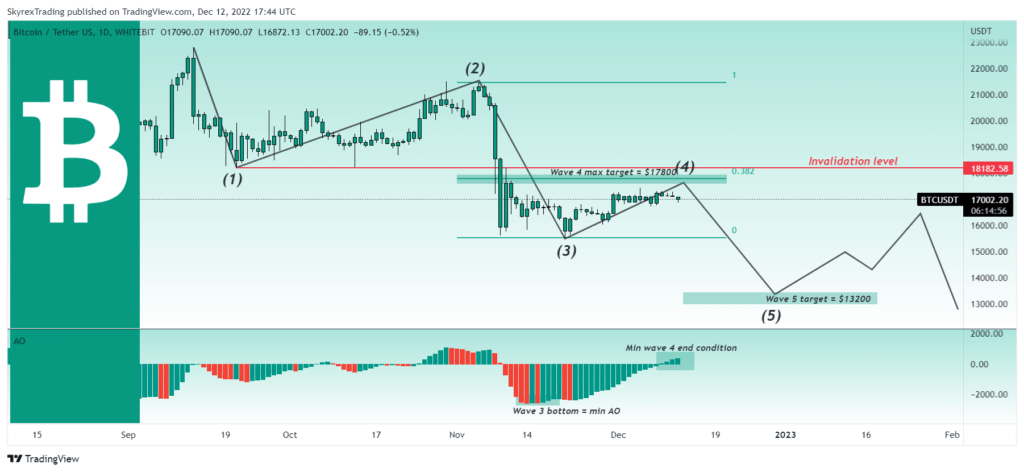
It’s time to refresh our global Bitcoin analysis because I have some evidences that the new impulsive wave to the downside is about to happen.
Bitcoin – liquidity collection will cause the dump!
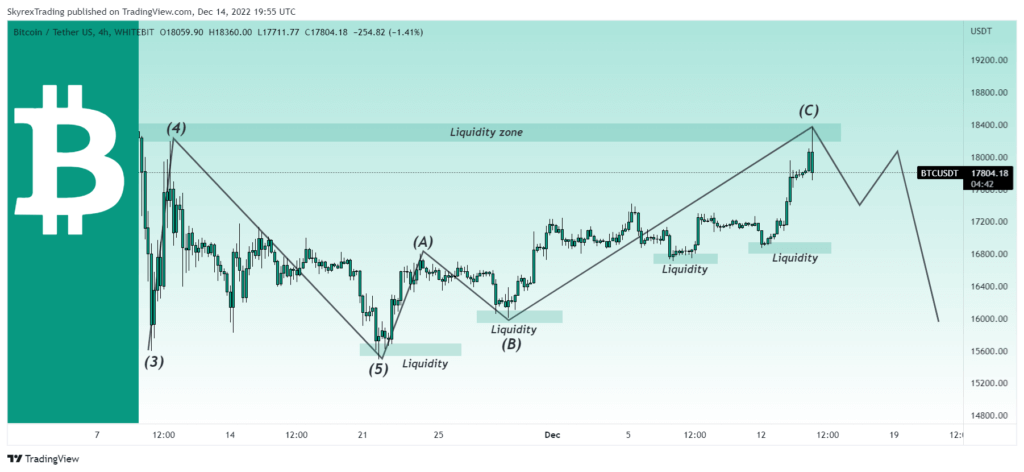
The target from the previous article has been reached and I think that Bitcoin will not grow above the current price.
Ethereum (ETH) – every pump only for short!
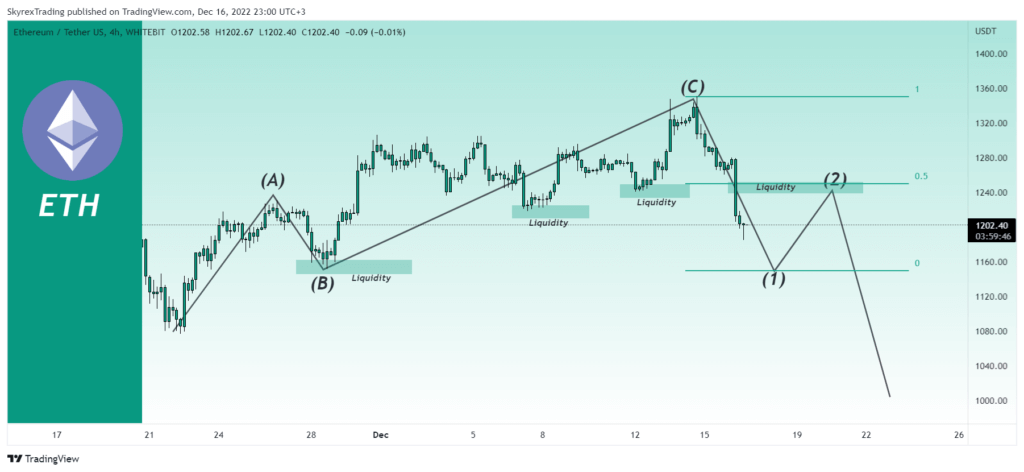
It’s time for Ethereum analysis. If you remember my last analysis it has the target $500 and there are no reasons to buy it higher.
Bitcoin has no reasons to grow?
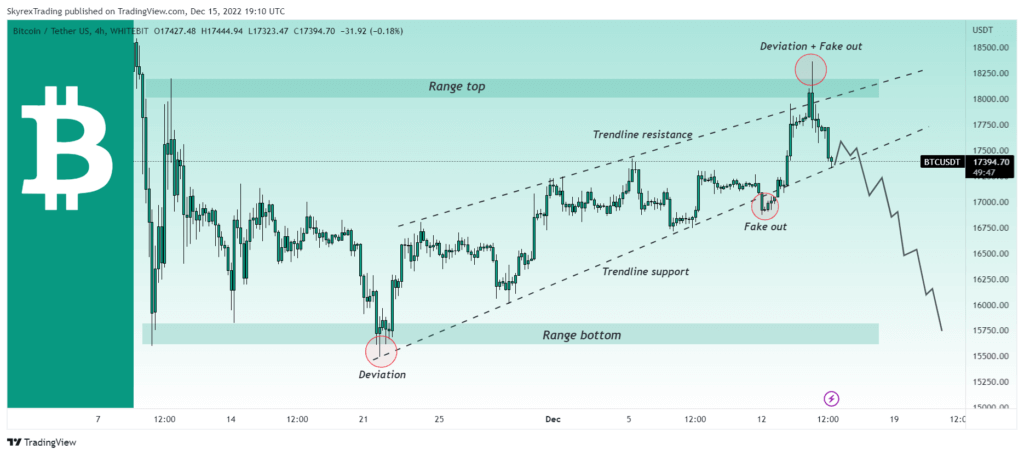
After reaching the maximal target for the local corrective wave 4 the Bitcoin price started to decline.
